Startup Math Made Simple: How to Know If Your Business Is Ready to Scale Ad Spend
Learn the simple unit economics math that reveals whether your business is genuinely ready to pour money into paid ads. Master LTV:CAC ratios, payback periods, retention guardrails, and sustainable growth formulas without confusing financial jargon.
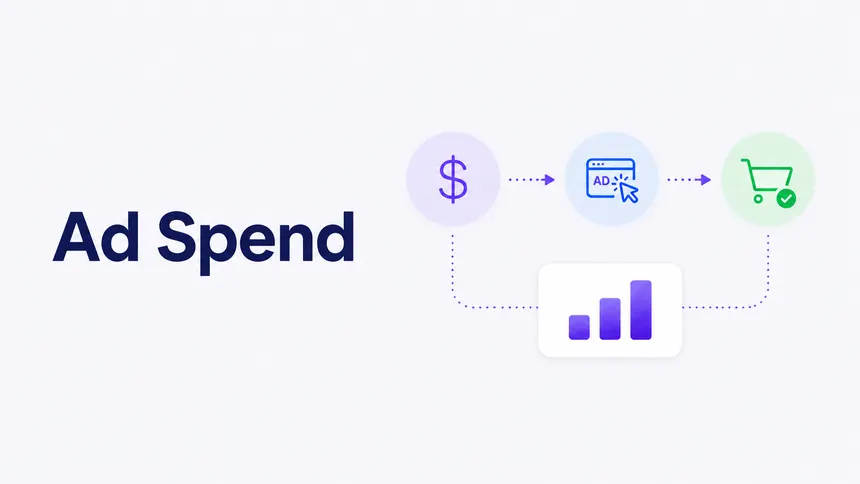
TL;DR: Pouring thousands of dollars into paid advertising before your underlying business math is healthy is like pouring jet fuel into an engine with a cracked piston—you won't go faster, you'll just burn cash. Many founders rush into paid ad channels hoping for an overnight growth miracle, only to suffer crippling customer acquisition costs and rapid churn. True scalability begins with healthy unit economics. When your customer lifetime value (LTV) is at least 3x your customer acquisition cost (CAC), your CAC payback period is under 12 months, and your customer retention curve flattens into a predictable baseline, paid marketing becomes a reliable revenue vending machine. Explore our Go-to-Market Strategy and growth advisory to align your growth engine, learn how to construct sustainable B2B SaaS pricing architectures, discover our 90-day GTM sprint playbook, audit your revenue bottlenecks with our 90-day digital growth roadmap, and use behavioral email automation to maximize customer retention.
The 5 W's of Startup Unit Economics & Paid Ad Scalability
To understand why measuring core financial metrics is essential before increasing your advertising budget, here is the complete breakdown using the 5 W's:
- Who: Startup founders, CEOs, growth leads, and bootstrapped operators deciding whether to unlock paid marketing budgets or continue refining product-market fit.
- What: Unit Economics Scalability Math—a straightforward financial framework that measures whether each new customer acquired produces significantly more gross profit than the cost required to acquire and serve them.
- Where: Tracked across your financial dashboards, Stripe or billing platforms, CRM pipelines, and multi-touch analytics attribution models.
- When: Evaluated before launching major Meta, Google, or LinkedIn ad campaigns, raising growth capital, or ramping up sales team hiring.
- Why: Advertising is an amplifier. If your unit economics are profitable and your product retains users, ads accelerate compounding wealth. If your economics are negative, ads accelerate bankruptcy.
┌─────────────────────────────────────────────────────────────────────────┐
│            The 5 W's: Startup Unit Economics & Ad Scalability           │
├──────────────┬──────────────────────────────────────────────────────────┤
│ Dimension    │ Plain-English Explanation                                │
├──────────────┼──────────────────────────────────────────────────────────┤
│ 👤 WHO       │ Founders and growth leaders planning marketing budgets   │
│ 🧠 WHAT      │ Core formulas: LTV, CAC, Payback Period, and Retention   │
│ 🔒 WHERE     │ Stripe billing, CRM records, and attribution analytics   │
│ ⏱️ WHEN      │ Before allocating significant capital to paid channels   │
│ 🎯 WHY       │ Ensure every ad dollar generates predictable net profit  │
└──────────────┴──────────────────────────────────────────────────────────┘
The Rocket Analogy: The Leaky Fuel Tank vs. The Sealed Rocket Engine
To see why unit economics must precede paid ad spend, picture a team preparing a rocket for launch:
Scenario A: The Leaky Fuel Tank (Premature Ad Spend)
Imagine buying thousands of gallons of high-grade rocket fuel (expensive paid advertising) and pouring it directly into a rocket that has multiple hairline fractures in its fuel tank (high customer churn, low gross margins, and confused onboarding).
No matter how fast you pump in the fuel, it leaks out onto the launchpad. The rocket burns through hundreds of thousands of dollars, never creates enough sustained thrust to break gravity, and eventually runs completely out of fuel. The founder is left wondering why their "marketing strategy" failed.
Scenario B: The Sealed Rocket Engine (Disciplined Unit-Economics Scaling)
Now imagine spending a few focused weeks inspecting the engine:
- You weld every seam tight so zero fuel is wasted (you refine customer onboarding and fix churn).
- You calibrate the fuel injectors for maximum efficiency (you set value-based pricing and ensure 80%+ gross margins).
- You verify that every gallon of fuel generates 3x its weight in forward momentum (LTV:CAC is 3:1 or higher).
Now, every single gallon of fuel you pump in propels the rocket higher and higher. Pumping in more fuel directly accelerates orbit. That is what paid advertising feels like when your startup math is sound.
┌─────────────────────────────────────────────────────────────────────────┐
│         Scenario A: Premature Ad Spend (The Leaky Bucket)               │
├─────────────────────────────────────────────────────────────────────────┤
│ [Paid Ads: $10,000/mo] ──► [Acquire 100 Signups at $100 CAC]            │
│                                    │                                    │
│                                    ▼                                    │
│ [High Churn: 70% Leave in Month 1] ──► [Average LTV: $80]               │
│ ❌ Result: Loss of $20 per customer, $2,000 monthly burn, rapid failure  │
├─────────────────────────────────────────────────────────────────────────┤
│         Scenario B: Unit-Economics Scaled Engine (Predictable ROI)      │
├─────────────────────────────────────────────────────────────────────────┤
│ [Paid Ads: $10,000/mo] ──► [Acquire 100 Signups at $100 CAC]            │
│                                    │                                    │
│                                    ▼                                    │
│ [Sticky Product: 85% Retention] ──► [Average LTV: $450 (4.5x CAC)]     │
│                                    │                                    │
│                                    ▼                                    │
│ [Payback Period: 3.2 Months]   ──► [Reinvest Profits into Growth]       │
│ ✅ Result: $35,000 net customer value created, profitable expansion     │
└─────────────────────────────────────────────────────────────────────────┘
The 4 Core Math Formulas Every Founder Must Master
You don't need a finance degree to evaluate your startup's health. You only need four fundamental formulas:
┌─────────────────────────────────────────────────────────────────────────┐
│               4 Essential Unit Economics Formulas for Growth            │
├─────────────────────────────────────────────────────────────────────────┤
│ 1. 🎯 CUSTOMER ACQUISITION COST (CAC)                                   │
│    Formula: CAC = Total Marketing & Sales Costs / Total New Customers   │
├─────────────────────────────────────────────────────────────────────────┤
│ 2. 💎 CUSTOMER LIFETIME VALUE (LTV)                                     │
│    Formula: LTV = (Average Monthly Revenue per User × Gross Margin %)   │
│                   / Monthly Churn Rate                                  │
├─────────────────────────────────────────────────────────────────────────┤
│ 3. ⚖️ THE LTV:CAC RATIO (THE 3:1 BENCHMARK)                             │
│    Target: 3.0x to 5.0x (Under 2x = Danger; Over 6x = Under-Investing)  │
├─────────────────────────────────────────────────────────────────────────┤
│ 4. ⏱️ CAC PAYBACK PERIOD (CASH FLOW HORIZON)                            │
│    Formula: Payback Months = CAC / (Monthly ARPU × Gross Margin %)       │
│    Target: Under 12 Months (Ideal: 5 to 8 Months)                       │
└─────────────────────────────────────────────────────────────────────────┘
1. Customer Acquisition Cost (CAC)
$$CAC = \frac{\text{Total Marketing & Sales Spend (Ad Spend + Agency Fees + Tools)}}{\text{Number of New Paying Customers Acquired}}$$
Critical Warning: Always calculate Paid CAC (ad spend divided strictly by customers from paid ads) separately from Blended CAC. Blending organic referrals with paid ad conversions creates a false sense of security and hides unprofitable ad campaigns.
2. Customer Lifetime Value (LTV)
$$LTV = \frac{\text{Average Revenue Per User (ARPU)} \times \text{Gross Margin %}}{\text{Monthly Churn Rate}}$$
For example, if your average SaaS customer pays $100/month with an 80% gross margin and your monthly churn rate is 4% (0.04): $$LTV = \frac{$100 \times 0.80}{0.04} = \frac{$80}{0.04} = $2,000$$
3. The Golden LTV:CAC Ratio
- Less than 1:1: You are losing money on every single customer you sign. Scaling ads will accelerate insolvency.
- 1:1 to 2:1: Dangerous territory. Overhead, refunds, and payment processing fees will leave zero net profit.
- 3:1 to 5:1 (The Sweet Spot): Healthy, scalable, and highly profitable. Every $1 invested in customer acquisition yields $3 to $5 in gross margin.
- Greater than 6:1: You are likely under-investing in marketing. You have room to bid more aggressively and capture market share from competitors.
4. CAC Payback Period (The Cash Flow Lifeline)
$$Payback;Months = \frac{CAC}{\text{Monthly ARPU} \times \text{Gross Margin %}}$$
Even with a great LTV, if it takes 24 months to recover the cash you spent on today's ads, your business will run out of working capital before those profits arrive. High-performing startups aim for a CAC payback period of under 12 months (and ideally 5 to 8 months).
Premature Ad Scaling vs. Disciplined Unit-Economics Scaling
Here is how startups operating on gut instinct compare against those built on disciplined mathematical foundations:
| Evaluation Dimension | Premature Ad Scaling (Gut Instinct) | Disciplined Unit-Economics Scaling | What This Means for Your Business |
|---|---|---|---|
| Trigger to Spend Ads | "We raised money and need growth" | Proven LTV:CAC > 3:1 and Payback < 9 mo | Replaces risky guesswork with predictable math. |
| Attribution Model | Looks only at platform reported ROAS | First-party CRM & server-side tracking | Eliminates double-counted conversions and wasted spend. |
| Gross Margin Awareness | Ignores hosting, support, and COGS | Factor in true net gross margins | Prevents high top-line revenue with negative bottom line. |
| Customer Retention Baseline | Unstable cohort retention curves | Flat, predictable month-6+ retention | Ensures acquired customers stay and generate profit. |
| Organic Baseline | 0% organic conversion validation | Proven organic conversion > 2% | Confirms message-market fit before pouring ad dollars. |
| Scaling Velocity | 10x budget increases overnight | Controlled 20% weekly budget scaling | Prevents ad fatigue and sudden CPA spikes. |
| Long-Term Outcome | High burn rate, emergency down-rounds | Self-funding, compounding enterprise value | Builds a durable, profitable business engine. |
The 4-Stage Readiness Checklist Before Spending $1 on Paid Ads
Before opening your advertising dashboard, make sure your startup passes these four mandatory operational gates:
┌─────────────────────────────────────────────────────────────────────────┐
│             The 4-Stage Paid Ad Scalability Readiness Checklist         │
├─────────────────────────────────────────────────────────────────────────┤
│ [Stage 1: Retention Cohort Stability]                                   │
│ └── Does your month-3 to month-6 retention curve flatten into a line?   │
│                                │                                        │
│                                ▼                                        │
│ [Stage 2: Organic Conversion Validation]                                │
│ └── Does your landing page convert unpaid visitors at ≥ 2.0%?           │
│                                │                                        │
│                                ▼                                        │
│ [Stage 3: Full-Funnel Attribution Plumbing]                             │
│ └── Are webhooks and server-side conversion APIs passing clean data?    │
│                                │                                        │
│                                ▼                                        │
│ [Stage 4: Working Capital & Payback Buffer]                             │
│ └── Can your cash reserves support a 6-month CAC payback cycle?         │
│                                │                                        │
│                                ▼                                        │
│ 🚀 [VERDICT: UNLOCK & SCALE PAID MARKETING WITH CONFIDENCE]             │
└─────────────────────────────────────────────────────────────────────────┘
Stage 1: The Retention Cohort Test
Look at your monthly cohorts from 3 and 6 months ago. Do customers stay, or do they drop off to zero? If your retention curve continues to decline steeply after month 2, pouring money into paid ads will only mask a leaky product. Fix user onboarding first.
Stage 2: The Organic Conversion Baseline
Ensure your website's value proposition is clear enough that organic visitors convert at 2% or higher. If your organic traffic converts at 0.4%, paid ad traffic (which has lower initial intent) will convert at even lower rates.
Stage 3: Full-Funnel Attribution Plumbing
Do not rely solely on Meta or Google pixel tracking. Implement server-side conversion webhooks directly from Stripe into your analytics tool so you optimize campaigns based on real paid revenue, not temporary free trial clicks.
Stage 4: Working Capital & Payback Buffer
Verify that your bank balance can comfortably float ad spend during the payback cycle. If your CAC payback period is 6 months, you must have enough runway to cover ad bills while customer subscription cash flows in month-by-month.
Real-World Story: How a B2B Logistics SaaS Slashed Payback from 22 Months to 7 Months
┌─────────────────────────────────────────────────────────────┐
│    Logistics SaaS: Unit Economics Transformation Metrics    │
├─────────────────────────────────────────────────────────────┤
│ Metric                       │ Before Audit │ After Strategy│
├──────────────────────────────┼──────────────┼───────────────┤
│ 💸 Customer Acquisition Cost │ $4,800       │ $2,450 (-49%) │
│ 💎 Customer Lifetime Value   │ $6,200       │ $14,700 (+137%)│
│ ⚖️ LTV:CAC Ratio             │ 1.29x (Risky)│ 6.00x (Elite) │
│ ⏱️ CAC Payback Period        │ 22.4 Months  │ 6.8 Months    │
│ 📈 Monthly Ad Spend Capacity │ Capped $5k/mo│ Scaled to $65k│
└─────────────────────────────────────────────────────────────┘
The Challenge:
A B2B software startup offering dispatch and routing software for regional trucking fleets was spending $15,000 per month on Google Search and LinkedIn ads.
While they were generating signups, their CAC was $4,800 and their average customer churned after 8 months due to confusing onboarding. With an average monthly subscription of $350 and a 75% gross margin, it took over 22 months to recover their ad spend. Their cash reserves were dwindling rapidly, and their investors warned them to halt all advertising.
The LaunchLive Studio Solution:
- Restructured Packaging & Pricing: We helped them transition from flat monthly billing to a usage-tiered model linked to active fleet size, raising initial contract value by 45%.
- Built Event-Driven Onboarding Workflows: Using behavioral triggers, we eliminated onboarding drop-off points, cutting 90-day churn by more than half.
- Refocused High-Intent Ad Channels: We eliminated broad keyword match campaigns and focused ad spend exclusively on high-intent fleet replacement searches.
- Instrumented Real-Time LTV Dashboards: The leadership team gained real-time visibility into paid payback periods across every marketing channel.
The Results:
- CAC dropped by nearly half to $2,450.
- Customer Lifetime Value skyrocketed from $6,200 to $14,700.
- The CAC payback period compressed from 22.4 months down to just 6.8 months.
- With healthy unit economics established, the company safely scaled its paid advertising budget from $15,000 to $65,000 per month, generating over $2.8M in net new ARR within 12 months.
5 Traps to Avoid When Scaling Paid Ad Spend
Avoid these five common financial mistakes when planning your marketing budget:
- Relying on Blended CAC: Blending cheap organic leads with expensive paid ad clicks disguises unprofitable ad campaigns. Always measure Paid CAC in isolation.
- Ignoring Gross Margins in LTV: If your software has high server or third-party API costs (e.g., LLM tokens or SMS fees), your gross margin might be 60% rather than 85%. Always multiply revenue by gross margin when calculating LTV.
- Treating Ads as a Cure for High Churn: Ads bring people to your door; they do not convince them to stay. If customers leave after 30 days, pause ads immediately and solve product retention.
- Over-Optimizing for Vanity ROAS: An ad platform may claim a 5.0 ROAS by taking credit for existing customers who clicked an ad to log in. Always verify incremental revenue in your CRM and Stripe dashboard.
- Scaling Budgets Too Fast (The 5x Shock): Increasing an ad budget from $2,000/month to $20,000/month in a single week breaks ad platform bidding algorithms and causes CPAs to spike. Scale budgets gradually by 15% to 25% per week.
Frequently Asked Questions (FAQ)
What is a realistic LTV:CAC ratio for an early-stage B2B SaaS startup?
For early-stage B2B SaaS, an LTV:CAC ratio of 3:1 to 4:1 is the gold standard. Anything below 2.5:1 indicates your pricing is too low, churn is too high, or acquisition channels are inefficient.
How much should we spend on paid ads during our initial demand testing phase?
During initial validation, you do not need large budgets. Spending $1,500 to $3,000 over 30 days on targeted search or social ads is sufficient to test messaging resonance, landing page conversion rates, and initial customer quality.
How does customer churn affect our ability to scale ad spend?
Churn directly caps your Customer Lifetime Value. If your monthly churn rate is 10%, the average customer only stays for 10 months. Halving your churn to 5% instantly doubles customer lifetime value, allowing you to profitably spend twice as much on ad acquisition.
When should a company transition from organic-only growth to paid ads?
You are ready for paid ads when you have proven product-market fit, a validated landing page conversion rate of at least 2%, a predictable onboarding flow, and a documented CAC payback period under 12 months.
How does LaunchLive Studio help startups fix their unit economics and GTM strategy?
At LaunchLive Studio, we work alongside founders to audit customer acquisition funnels, redesign pricing and packaging models, plug onboarding leaks, and architect sustainable 90-day growth roadmaps that make every marketing dollar profitable.
Ready to Build a Scalable, Profitable Growth Engine?
If you are tired of burning cash on unpredictable marketing campaigns and want to turn your acquisition math into a reliable revenue engine, let's look at the numbers together.
👉 Book a Free 30-Minute Growth & Unit Economics Audit with the LaunchLive Studio advisory team today. We'll analyze your current LTV, CAC, and payback benchmarks and give you a clear roadmap to scale profitably.
Enjoyed this insight
on Go-to-Market Strategy & Unit Economics?
"At Launch Live Studio, we help ambitious brands implement these exact systems to drive scalable revenue."
FREE 30-MINUTE STRATEGY CONSULTATION • CLEAR ANSWERS ON OUR FAQ
Related Growth Guides.
Website Development & Full-Stack Architecture
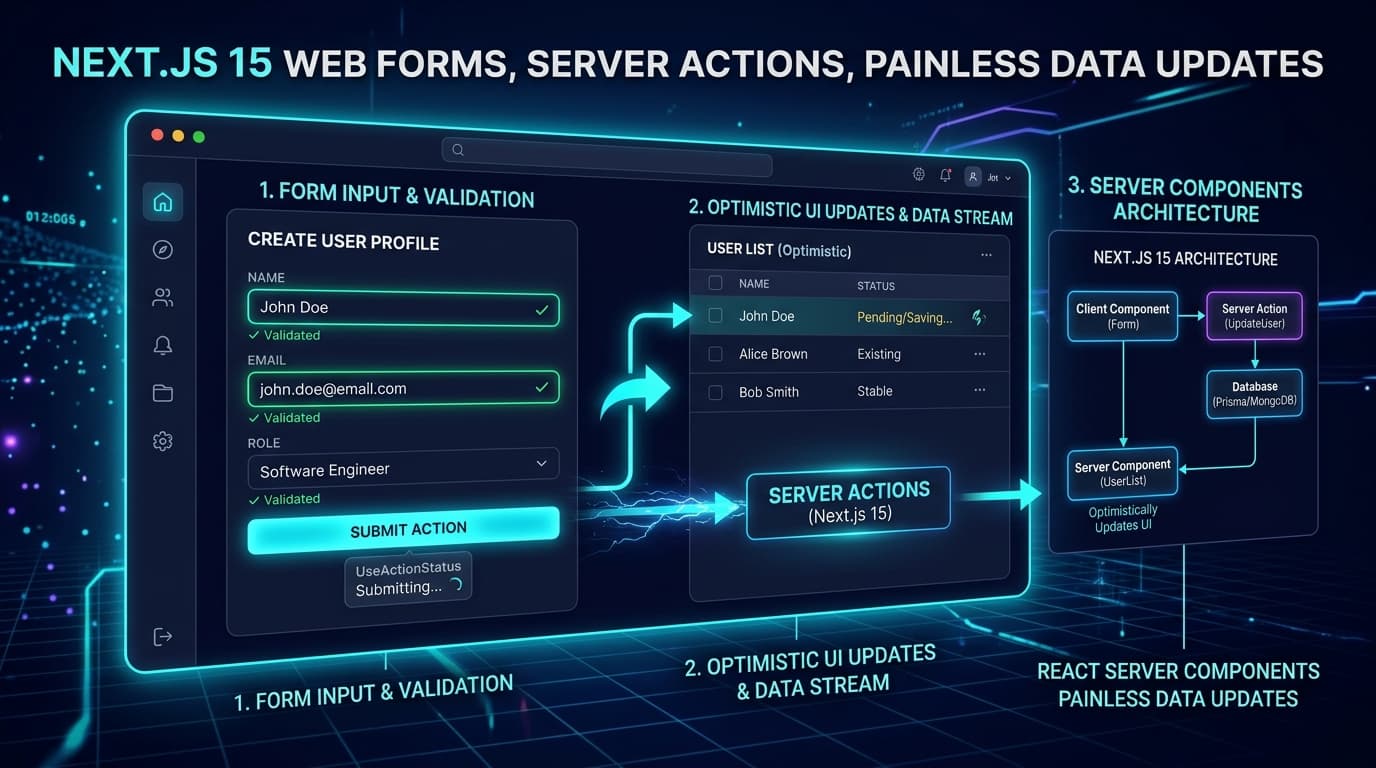
Building Simpler Web Forms: How Next.js 15 Makes Data Updates Quick and Painless
Master modern form handling with Next.js 15 and React 19. Learn how native Server Actions, useActionState, useOptimistic, and Zod schema validation eliminate boilerplate, achieve sub-50ms feedback, and ensure flawless data integrity.

AI Tool Creation & Software Modernization
Upgrading Outdated Software with AI: How Modern Teams Automate Boring Code Updates Safely
Discover how modern engineering teams safely automate legacy software modernization using AI. Learn how Abstract Syntax Tree (AST) parsing, synthetic characterization testing, sandboxed refactoring agents, and human-in-the-loop verification reduce migration time by 80% with zero production downtime.

AI System Creation & Cost Optimization
Small AI Models vs Big AI Models: How to Pick the Right Tool, Cut Costs, and Protect Privacy
Master the strategic decision framework between Small Language Models (SLMs) and Frontier Large Language Models (LLMs). Learn how modern engineering teams use intelligent model routing, on-premise local hosting, and targeted LoRA fine-tuning to slash inference costs by 80%, achieve sub-200ms response times, and guarantee 100% data privacy.